Debugging FAQ
Why do I need to debug?
Debugging is the easiest way to fix issues AND check your work when programming.
It is an essential and required skill as a developer and can save you hours of possible extra work rewriting code by helping you better understand where issues and bugs may be coming from.
If you have not yet setup VSCode, see the Programming Assignment FAQ. To use the debugger, you should install the following VSCode extension packs for Java, either through your web browser or the “Extensions” tab in VSCode.
Once you have setup the debugger, you can run in debug mode via the “Run and Debug” option in the left sidepane, or by selecting “Run -> Start Debugging” in the top menubar.
Run and Debug Window
When running in Debug Mode, we have a few ways to evaluate how our code is running.
- We can use the Debugger Toolbar to run our code line-by-line, or in chunks.
- We can set Breakpoints on any line(s) of code. When the program is run in debug mode, the execution of code will pause right before executing any lines containing a breakpoint.
- We can also set Conditional Breakpoints, which will only pause the program IF the given boolean condition is met.
- We can use the Run and Debug window while the program is paused on a breakpoint to view the values of Variables, both local and global.
Using these and some simple techniques, it’s possible to investigate how programs work and determine where potential errors may be.
How to use Debug Mode
When running our program in Debug Mode, we have a few ways to evaluate how our code is functioning.
- We can use the Debugger Toolbar to run our code line-by-line, jump inside and out of methods, as well as continue running until we find a breakpoint/the program ends.
- We can set Breakpoints on any line(s) of code. When the program is run in debug mode, the execution of code will pause right before executing any lines containing a breakpoint.
- We can also set Conditional Breakpoints, which will only pause the program IF the given boolean condition is met.
- We can use the Run and Debug window while the program is paused on a breakpoint to view the values of Variables, both local and global.
Using these and some simple techniques, it’s possible to investigate how programs work and determine where potential errors may be.
To show this, we will use a short example program, which you can download for yourself here to follow along.
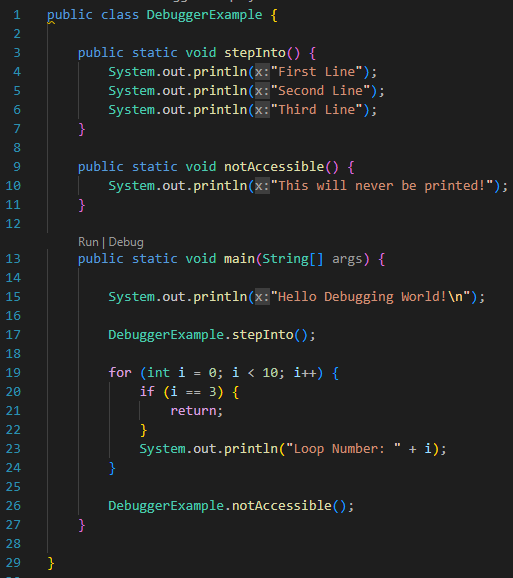
This program has three methods:
- main – This is the main method. When you run a compiled java file (either via the command line or through VSCode), this is where the code starts running.
- When you run the Driver for any Programming Assignment, it calls the Drivers main method. That main method then calls other methods and constructors, to create GUIs and run your code.
- stepInto – This method contains three lines, which each prints a String.
- notAccessible – This method contains one line, which should print a String.
All three methods have the static modifier. View the OOP Guide for more info on static methods.
Using Breakpoints and the Debugger Toolbar
To set a breakpoint, click in the empty space to the left of the line number you wish to pause on. A red circle should appear, indicating a breakpoint has been set.

Once the program is run in debug mode, that breakpoint will stop the program from running the line it is on, to allow you to evaluate the data at that time, as well as watch how the program evaluates the following lines.

If we set breakpoints on lines 15, 5, 10, and 21, we can see how the example program runs. It starts at the top of main(), and first pauses before it prints “Hello Debugging World!” to the terminal (seen above)
From the breakpoint shown above, we can use the Step Over button ![]() to evaluate just the highlighted line when paused, and then pause at the next line, shown below. This evaluates the print statement, which prints “Hello Debugging World!” to the terminal.
to evaluate just the highlighted line when paused, and then pause at the next line, shown below. This evaluates the print statement, which prints “Hello Debugging World!” to the terminal.
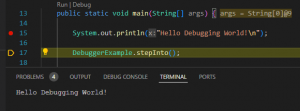
Using Step Over literally steps over method calls, and does not go inside them. I.e. if we click “Step Over” while paused on line 17 shown above, it will execute the entire “stepInto()” method, and then pause on the next line (line 19).
Another option while paused on the line shown above, is to use the Step Into ![]() button to jump inside the highlighted method. This can be used to investigate methods, constructors, as well as just the general control flow of your program. Likewise, we can use Step Out
button to jump inside the highlighted method. This can be used to investigate methods, constructors, as well as just the general control flow of your program. Likewise, we can use Step Out ![]() to exit a method. Clicking this button will continue running the code until the current method is finished, then it will pause when it returns to where the method was originally called.
to exit a method. Clicking this button will continue running the code until the current method is finished, then it will pause when it returns to where the method was originally called.
Finally, we can use the Continue ![]() button to resume the code running from the highlighted line, pausing at the next breakpoint if one is found. Doing this from the same spot as shown in the image above (before stepInto()) will bring us to our next breakpoint, which pauses our program on line 5 (inside the stepInto() method).
button to resume the code running from the highlighted line, pausing at the next breakpoint if one is found. Doing this from the same spot as shown in the image above (before stepInto()) will bring us to our next breakpoint, which pauses our program on line 5 (inside the stepInto() method).

Since we “continued” to line 5, it will print “First Line” to the console, and pause before the second print statement. There, we can once again use any of our debugger toolbar options listed above. We will choose to click “Continue” once more.
Finally, the program pauses at line 21, when i == 3, and we can see it printed 0, 1, and 2 as loop iterations, shown below.

From here, clicking Step Over will evaluate the return statement and exit from main(), and thus the program.
We can notice that one breakpoint (line 10) was never reached when we clicked continue. So, we can infer that notAccessible() was never ran. We know this is true, because the program returned in the for-loop, before the method could be called.
It’s important to become comfortable using Debug mode, simple breakpoints, and the debugger toolbar in simple situations like these. This allows you to more easily debug larger and more complex programs in the future.
Conditional Breakpoints
In VSCode, if you right click on a breakpoint and click “Edit Breakpoint”, a single line text input will pop up on that line. This allows you to enter a boolean condition, which will then be used to determine if the breakpoint should stop.
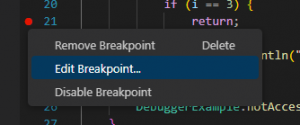

Reminder: Boolean conditionals evaluate to true or false
(personName.equals("Amy") && personAge == 43)(i == 15 || i > 20)
These conditions have access to all variables which are accessible at the breakpoints line, including loop conditions/variables. This also includes any local and instance variables which are in scope at the paused line.
An example of good conditional breakpoint use is: if your method is functioning correctly for many of the test cases, you can set a conditional breakpoint to stop the program at a singular case which it is NOT functioning correctly. Then you can use Step Over to evaluate the behavior of your code, and find the error.
Conditional Breakpoints may increase the runtime of your code due to the repeated boolean check.
For Example:
Using the same example from above, we can set a conditional breakpoint at line 20, with the condition (i == 2).

Then when running in debug mode, this will pause the program on line 20 only when “i == 2” evaluates to true.

If we set the condition to “i == 4” or above, it would not pause, since the program exits when i == 3.
Note: This works for any valid boolean condition, including ones using .equals() when appropriate.
Breakpoint Strategy
When using Breakpoints to debug code, we want to narrow down the problem areas as much as possible.
If data is outputting incorrectly in methods, first use a breakpoint to check the values you return. Then, you can move the breakpoints up in your code, to evaluate how the data is modified/formed throughout the program. Try to narrow down issues to specific cases of the program, often found within if blocks or loops (including loop conditions).
Often times, you can find issues by setting a breakpoint before problem areas, and then reading the instance variables to guess how your program SHOULD run. Then, using Step Over you can compare your educated guess to how the program actually runs.
Breakpoints can also tell you if code is not being reached at all, because of an early exit, incorrect conditional, or infinite loop somewhere. This is shown with the line 10 breakpoint in the previous section. Incorrect If-conditions and loop conditions are common issues.
Breakpoints are also useful to fix runtime errors. Since you are given a line number that the error occurred on, you can use breakpoints/conditional breakpoints with Step Over, to determine the reason for the exception. This allows us to determine specifically when the target line is causing an error (as it may only be one or two cases). Remember, conditional breakpoints can help us save time in this debugging with statements like (i > array.length) OR (ptr.next == null).
How to Debug with Command-Line Arguments
Often, we want to run our program with command-line arguments, which specify input files or values for the program to use. These arguments are passed into the main() method of the class we run in a String array. For more info on main() and command line arguments, see this main() guide or the OOP Guide. There are two ways to use Command-Line inputs while using the VSCode debugger:
The first is configuring your “launch.json” file, which tells VSCode what arguments to pass in when you click the Run/Debug button.
To create a launch.json config file, you must first be in a Java project. Then, click “Run -> Add Configuration…”, which will create/open a launch.json file for your project.
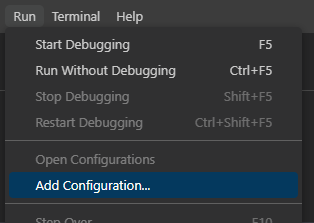
Note: .json is a standard text-based format for representing structured data based on JavaScript object syntax. It allows for easy organization and labeling of data.
After you create and open your launch.json file, you should see something similar to the following. It has a block of info for each class, which determines the arguments for that specified class. Based on the String next to each “name” label, you can tell which block belongs to what class.

The second block shown above belongs to a class in this java project, and the class is called “MainExample”. Which is the program shown below.

When run, this will take the command line arguments (which is passed in as an array of Strings called “args”). It will print out the number of args given, and then each arg, all on one line.
When we run this class via the command line with two args, “Red” and “Blue”, this is the output:
![]()
To run with these two program arguments using the VSCode Debugger instead of the command-line, we add a new line to the class block in launch.json. The line should be formatted as “args”:”arg1 arg2 ….”.
Before:
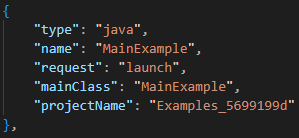
After:

Note that we also needed to add a comma to the end of the “projectName” line. This signifies that there is still another line to read.
Now when we run the “MainExample” class with the VSCode debugger, we get the same output as before, without using the command line.

Alternatively…
If using the command line to pass in file names, you can alternatively choose to completely forgo using launch.json. Instead, you can choose to hardcode these file names in your program, for testing purposes ONLY. This allows you to run the debugger with no launch.json arguments, while your program runs the same since it still has access to the values you were going to pass in any way (via the hardcoded strings).
The pros of this: It can be easier to test with multiple files since you can modify the String filename value directly in the code of your program. The con of this is that it can be easy to forget about, which will certainly cause issues when the autograder/other people try to run your code WITH command-line arguments.
