Using the Java Debugger
As with the rest of the course, we will be working within VSCode for this Lab. Make sure you’ve installed all required extensions and removed any unnecessary ones, as stated on our Course FAQ page.
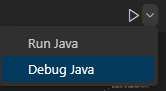
So far, you have most likely been running your programs using either the commands line (with compile commands), or using the VSCode run button. Now, you can use the drop down menu on the Run Button and select “Debug Java” to run the program in Debug mode instead.
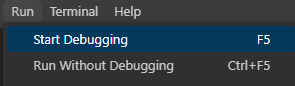
Alternatively, you can click “Start Debugging” under the “Run” menu on the top toolbar.
If you simply do this instead of the normal Run Java / Run Without Debugging, it will appear to be exactly the same result. Your program will run and exit, and produce any expected output.
HOWEVER, running in debug mode allows us to make use of breakpoints, which pause the code at certain spots.
Breakpoints
Breakpoints allow you to define certain lines for the program to pause running at, while running in debug mode. This is extremely useful, as it allows you to investigate specific edge cases, or specific parts of the bugged code.
You can place a breakpoint by clicking to the left of the line number you want pause at. Breakpoints are represented by a red circle.
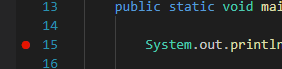
Then when you run in debug mode, the debugger will stop the program before executing that line, and will highlight that line to show it.
Nothing gets printed to the terminal yet, since that line of code has NOT been run yet.
You can also set Conditional Breakpoints, which will only pause if their given boolean condition is met. In this lab, you will use conditional breakpoints to pause the program at certain time values, to investigate the island at those times.
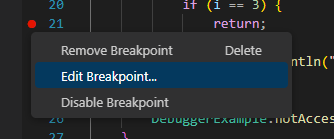

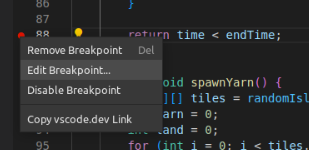
Once the breakpoint has been placed, edit it by left clicking on the breakpoint (red circle) and select Edit.
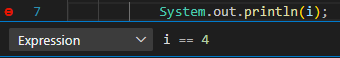
Then place a boolean condition in the text box that appears. These boolean conditions can be any valid condition, using any variables which are accessible from that line. i.e. “time == 110”, or even chained conditions like “time == 100 && cat.getName().equals(“Cat2″)”
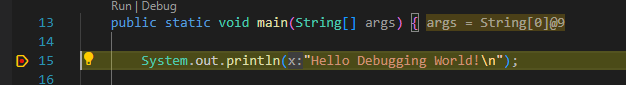
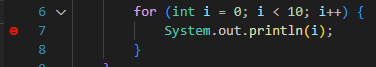
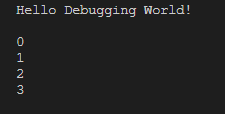
For example, we can set a breakpoint in the following code snippet, then set the breakpoint to only pause when i==4.
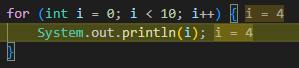
Then if we run in debug mode, we will see that it pauses at that line when i == 4. And we can see in the terminal that everything before i == 4 has already been printed.
Note: If you set a breakpoint but the program does not stop when run in debug mode, it means that line was never executed. This is usually because the line was never reached, or because the program is infinitely looping somewhere earlier on (thus never progressing).
Debugger Toolbar
After the program pauses at a breakpoint, we want to be able to control it from there, and execute any number of lines, or continue running until the end. To do this, we can use the Debugger Toolbar.
The debugger toolbar appears when running a program (even in non-debug mode). For any program that is actively running (for example, when you have the Driver open), the toolbar will appear as follows:
![]()
When paused at a breakpoint, the debugger toolbar will look like this instead:
![]()
You can then use this toolbar to navigate forward through the code, either line by line, or section by section. The buttons work as followed:
![]() Continue button – Will resume running the code, until it hits another (or the same) breakpoint, OR the program ends.
Continue button – Will resume running the code, until it hits another (or the same) breakpoint, OR the program ends.
![]() Step Over – Will execute the highlighted line of code, and pause on the next line of code
Step Over – Will execute the highlighted line of code, and pause on the next line of code
![]() Step Into – IF the highlighted line of code is a method call, you can use this to “step into” the method, and pause inside of it. This allows you to follow the logic when methods are being called.
Step Into – IF the highlighted line of code is a method call, you can use this to “step into” the method, and pause inside of it. This allows you to follow the logic when methods are being called.
![]() Step Out – IF you have Stepped Into a method call, you can use this step back out. Aka to finish the method instantly, and stop on the next line after the method call.
Step Out – IF you have Stepped Into a method call, you can use this step back out. Aka to finish the method instantly, and stop on the next line after the method call.
The green circular arrow is the Restart button, which allows you to stop and rerun the program. The red square is the Stop button, which will stop running the program.
It is important to become familiar with the Debugger toolbar, in particular the “Continue” and “Step Over” buttons. They allow you to easily navigate code after breakpoints, and jump to other breakpoints to ease the search while debugging.
Memory Viewer
Also while the program is paused, you can use the Memory Viewer to inspect variable values. The memory viewer can be accessed through the left sidebar, under the “Run and Debug Menu”
![]()
You can then see all the current variables in scope at the paused line.

This allows you to inspect values, to ensure they get initialized/update as expected. This is important for bug-hunting thinks like NullPointerExceptions, as it lets you identify when things do/don’t get set to a value or null.
In the above example, the only two variables in scope are “args” (from the parameters of the main() method), and “i” which is the for loop variable from the conditional breakpoint example above.
If we define another String variable, and pause the program after that variable has been created, we can see it too.
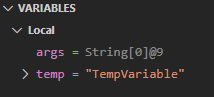
Note: since the for loop has ended, the “i” variable has dissapeared and been garbage-collected by Java.
The String variable has a drop down menu in the variable viewer, since it is an object which has attributes. We can open this to see the attributes.
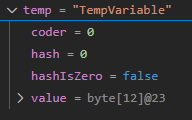
This is an important concept, as it allows us to investigate objects fully. Since the majority of Java code consists of objects, we need this to properly debug.
Debug Console
The final tool you will need to debug (and complete this Lab) is the Debug Console. The Debug Console is a special terminal, which can be accessed with Ctrl + Shift + Y (for Mac, use Command instead of Ctrl).
The debug console allows you to write and run singular lines of code, and print their output. For example, you can simply enter primitive values, and it will print those values back to you.
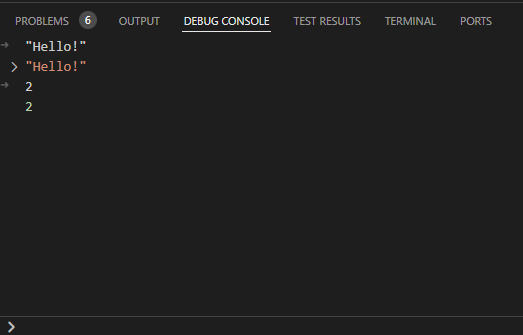
In the above screenshot, first “Hello!” is typed into the Debug Console (including the quote marks), then after pressing Enter, it is printed back to us. Second, the number 2 is entered, which again simply prints 2 back to us.
If we have a visible method which is accessible from the paused spot, we can call that as well and the Debug Console will print the output. If we use the previous example of the “String temp = “TempVariable”;”, and pause at the same spot, we can call that String objects methods and see the output.
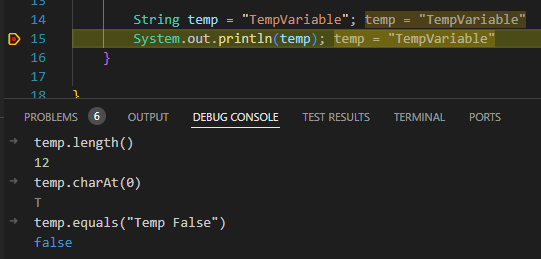
This allows us to call getter methods to get values. In the lab, you will use this in combination with conditional breakpoints in order to get info from certain cats and the island, using methods like cat.numYarnCollected(), or island.numLandTiles().
Overview
To complete this Lab, you will not need to write ANY code. Instead, you will run the Driver.java class and use it with the debugger to generate your submitted file.
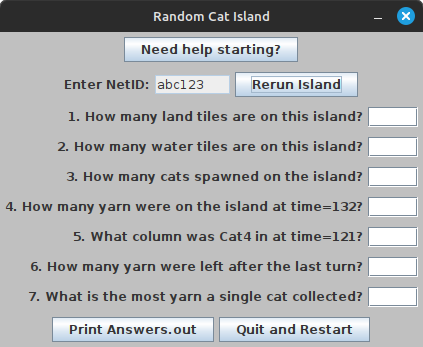
- The Driver class includes a small intro blurb to describe the Lab, as well as a text box for your netID. Enter your correct netID (ex: abc123, not your 9-digit RUID), then click the “Run Island” button.
- This will bring up a panel of questions, which you must answer using the debugging tools above. Once you do, you can click the “Print answers.out” button, which will print your given answers to an answers.out file in your project folder.
- This “answers.out” file is the one you submit.
- In other words, you are going on a scavenger hunt using the debugger. You must find the requested pieces of information and enter them in the driver, then submit the printed “answers.out” file to Autolab.
Getting Started: Once you run the driver, enter your NetID (ex: abc123, NOT your RUID). We recommend writing down your questions or screenshotting them before you start debugging. Then, you can set breakpoints using the debugger (see above), and rerun with those breakpoints. Remember that questions won’t show up until all turns are complete.
When you’re ready to submit, use the Driver to generate the answers.out file. It’ll include your NetID as well as a hash (a string representing your NetID). Make sure you enter all answers exactly as asked – don’t include any punctuation or wording (ex: if you’re asked for a number, ONLY write that number).
Provided Classes
You are provided the same Cat and Tile classes as the previous two labs. You are also provided the constants (CatInWaterException and Color)
For this lab, the Island class has additional methods for you to use (with the debug console). These are numLandTiles(), numWaterTiles(), and numYarnTiles(). You will use these methods to get the counts of tile types on the island, and find how much yarn is on the island at any given point.
The Driver class is modified, as it does not visualize the island. Instead it will run the whole simulation (250-300 “turns”) and then produces questions to answer. You should use the debugger techniques mentioned above to find the answers, then enter them in the Driver. Finally, click “Print answers.out” to print your answers to a output file, which you can submit to Autolab.
The RandomCatIsland class is a random island generator, which generates a connected island with 5 cats at random spots. It can also simulate “turns” on the island, where each cat can move and yarn can spawn. This is all randomly determined by a netID passed into the constructor.
Finally, the StdIn, StdOut, and StdRandom classes are provided for RandomCatIsland to use. Do not modify or remove these classes.
Directions
You MUST use your own NetID when running the island in the Driver, or you will receive a zero on the Lab.
- DO NOT add new import statements.
- DO NOT add any new class attributes
- DO NOT change any of the method’s signatures.
- DO NOT modify the given constructor.
- DO NOT modify any code related to game behavior.
- Modifying game behavior may cause you to find different answers than Autolab.
- You may mainly add if-statements to check logic for print statements. Do not use break, continue, return, or other similar keywords.
To Run: Run in Debug Mode through VSCode, ensuring you open the correct innermost RandomCatIsland directory.

Driver
The Driver class will at first show a prompt for your netID (abc123 form NOT your 9-digit RUID). After you enter it, you can run your Island.

Note: The “Read Me Before Running” contains a quick summary of the goal of the assignment.
The “Run Island” button will instantly simulate 150+ turns of cats moving around and yarn being spawned/collected. It will then switch the Driver to a panel of questions you must answer:
A few things about these questions will be randomized, including the time for questions 4 and 5, whether question 5 asks about the row or column, and the which cat question 5 asks about.
After generating your questions, you should then place breakpoints in the nextTurn() method of RandomCatIsland, and click the “Rerun Island” button. This should rerun the simulation and stop at your breakpoints. Use this tactic as well as others to find the answers to the questions, then input them in the Driver.
NOTE: You must use the “Continue” or “Step Out” buttons to continue past ALL breakpoints after using the Drivers “Rerun Island” button. While you are paused at any breakpoint, you will not be able to interact with the Driver.
After all questions are answered, click “Print Answers.out”, which will print an answers.out file to your project directory. This is the file you will submit.
Make sure you always run in Debug mode, or breakpoints will not work. Always run with YOUR netID.
Questions 1 – 3:
These questions pertain to the tile composition of the island. To answer this question, place a breakpoint anywhere in the nextTurn() method (preferably the first/last line). This will pause the simulation the first time that line of code is reached (on the first turn). Then, open the Debug console (located as a tab next to the Terminal).
In the debug console, you can access any variables available at the line of paused code. You can use this.randomIsland to access the island for your simulation. Then, use the Island class’s .numLandTiles() and .numWaterTiles() method. So:
Entering this.randomIsland.numLandTiles() in the Debug console will print the output of that method, so the number of land tiles on your island.
Entering this.randomIsland.numWaterTiles() in the Debug console will print the output of that method, so the number of water tiles on your island.
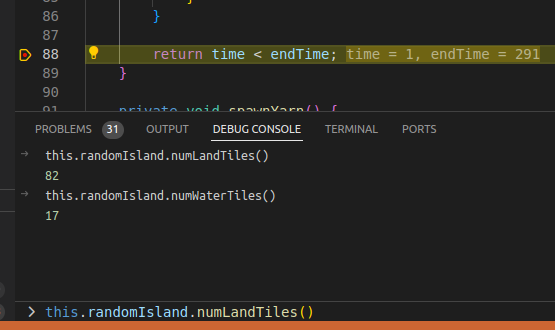
Note: Your numbers will be different than above, since the islands are randomized.
To find the number of cats on the island, you will check where they are all stored. RandomCatIsland has an ArrayList (java resizable Array class) called “cats” which stores all the cats.
To find the size, you can use the ArrayList .size() method.
Entering this.cats.size() in the Debug console will print the output of that method, so the number of cats on your island.
Questions 4 and 5:
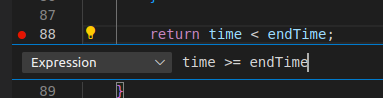
Both of these questions relate to your Island at a specific time. To pause your island at this time, you can use a conditional breakpoint. You should first place a breakpoint on the last line of the nextTurn() method (the return statement)
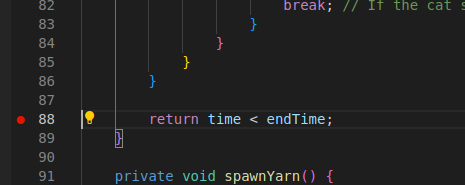
To place the breakpoint, click to the left of the number (where the red circle shows). Then, right click it and click “Edit Breakpoint”, which will open a line editor.
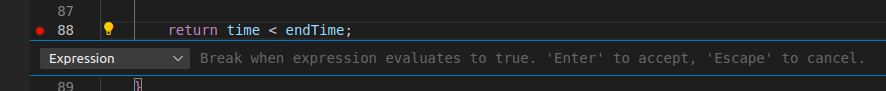
Enter conditions comparing to the “time” variable to stop at certain times. For the above example under the Driver section, the conditions would be (time == 132) or (time == 121). Hit enter when you type the expression in or it won’t save.
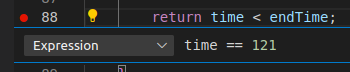
Note: Your time(s) will be different, since portions of some questions are randomized.
To answer question 4, you can use this.randomIsland.numYarnTiles() similar to Questions 1 and 2.
To answer question 5, you should use the Variables window under the Run and Debug menu. You should expand the this option (which represents the your RandomCatIsland object). Inside it, you can expand the cats ArrayList, to see the indices.
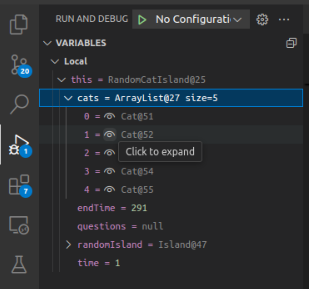
Select which cat you need (CatX is at index X – 1), and click the Eye icon next to any cat to expand it and see its attributes.
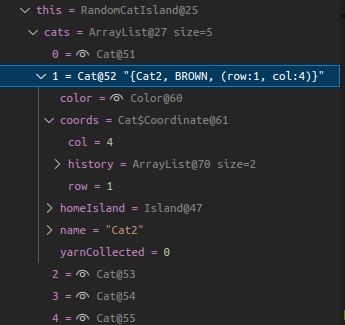
Then, either view the row/col under the Coords variable, OR view the message printed on the cat object (selected in blue).
Questions 6 and 7:
Both of these questions relate to the game at the END of the simulation. To pause at the end of the simulation, you want to pause when it returns false (aka when time >= endTime).
Place a conditional breakpoint exactly like questions 4 and 5, at the return statement of nextTurn(), with the condition (time >= endTime)
To find the number of yarn on the island at the end, use this.randomIsland.numYarnTiles(), which will print the number of yarn tiles at that time (similar to questions 1 and 2).
To find the most yarn collected, you should use the Variables window, and investigate each cat just like in Question 5. You should see what the highest “yarnCollected” attribute is. Whatever the highest value is, is the answer.
