Looking for Help with Assignments?
-RUCats has 80 hours of tutoring available online and in-person. Check the tutoring tab in Canvas!-Instructors and Lead TAs have a combined 10 hours of Office Hours, open to all sections. See times/locations here.
-Piazza (found in the Canvas sidebar) provides fast support from Course Staff and other Students. Be sure to search to see if someone has asked a similar question!
-If you need a computer to complete work on, iLab machines can be found in the CSL (Hill 252) and surrounding rooms.
Sort Solver - 10 Course Points
The purpose of this assignment is to practice using the Java Debugger, to investigate elementary sorts as they are randomly chosen to sort lines of an input file.
Make sure you install all required VSCode extensions and remove any unnecessary ones before starting. View the Course FAQ page for more info
You can download and submit the project files via Autolab.
What is Debugging?
Writing code is prone to bugs (mistakes), and when bugs do occur we need an efficient way to pinpoint where they are coming from. Often, when programs have mistakes they show a Compiler Error (red squiggily underline on VSCode), or throw an Exception, which is a Runtime Error, and crash the program. These both tell you their direct cause, allowing you to fix them.
- Compiler error: VSCode shows you a red squiggly underline. Basically like a grammar/spelling issue.
- Runtime error: Java shows you the call stack and which lines generated the exception. This is an error which signals an issue with the program while it’s running.
But what if we can’t visually identify why the program throws a Runtime Error? Or if the cause of a bug is not so clear? For example, if the program is compiling and running successfully, but outputting the wrong value? In that case, we need a way to investigate the code to see what is happening.
This process of investigation is called Debugging, and we can use a helpful tool called the Debugger to do so. The debugger allows us to pause code at certain spots/on certain conditions, and then investigate the values of each variable, in order to determine what is happening and if the code is functioning properly.
Using the Java Debugger
As with the rest of the course, we will be working within VSCode for this Lab. Make sure you’ve installed all required extensions and removed any unnecessary ones, as stated on our Course FAQ page.
So far, you have most likely been running your programs using either the commands line (with compile commands), or using the VSCode run button. Now, you can use the drop down menu on the Run Button and select “Debug Java” to run the program in Debug mode instead.

Alternatively, you can click “Start Debugging” under the “Run” menu on the top toolbar.

If you simply do this instead of the normal Run Java / Run Without Debugging, it will appear to be exactly the same result. Your program will run and exit, and produce any expected output.
HOWEVER, running in debug mode allows us to make use of breakpoints, which pause the code at certain spots.
Breakpoints
Breakpoints allow you to define certain lines for the program to pause running at, while running in debug mode. This is extremely useful, as it allows you to investigate specific edge cases, or specific parts of the bugged code.
You can place a breakpoint by clicking to the left of the line number you want to pause at. Breakpoints are represented by a red circle.

Then when you run in debug mode, the debugger will stop the program before executing that line, and will highlight that line to show it.

Nothing gets printed to the terminal yet, since that line of code has NOT been run yet.
You can also set Conditional Breakpoints, which will only pause if their given boolean condition is met. 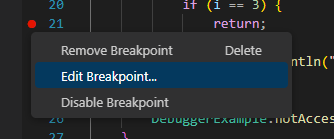

Once the breakpoint has been placed, edit it by left clicking on the breakpoint (red circle) and select Edit.
Then place a boolean condition in the text box that appears. These boolean conditions can be any valid condition, using any variables which are accessible from that line. i.e. “time == 110”, or even chained conditions like “time == 100 && cat.getName().equals(“Cat2″)”
For example, we can set a breakpoint in the following code snippet, then set the breakpoint to only pause when i==4.


Then if we run in debug mode, we will see that it pauses at that line when i == 4. And we can see in the terminal that everything before i == 4 has already been printed.

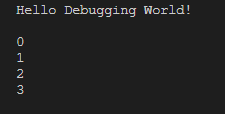
Note: If you set a breakpoint but the program does not stop when run in debug mode, it means that line was never executed. This is usually because the line was never reached, or because the program is infinitely looping somewhere earlier on (thus never progressing).
Debugger Toolbar
After the program pauses at a breakpoint, we want to be able to control it from there, and execute any number of lines, or continue running until the end. To do this, we can use the Debugger Toolbar.
The debugger toolbar appears when running a program (even in non-debug mode). For any program that is actively running (for example, when you have the Driver open), the toolbar will appear as follows:
![]()
When paused at a breakpoint, the debugger toolbar will look like this instead:
![]()
You can then use this toolbar to navigate forward through the code, either line by line, or section by section. The buttons work as followed:
![]() Continue button – Will resume running the code, until it hits another (or the same) breakpoint, OR the program ends.
Continue button – Will resume running the code, until it hits another (or the same) breakpoint, OR the program ends.
![]() Step Over – Will execute the highlighted line of code, and pause on the next line of code
Step Over – Will execute the highlighted line of code, and pause on the next line of code
![]() Step Into – IF the highlighted line of code is a method call, you can use this to “step into” the method, and pause inside of it. This allows you to follow the logic when methods are being called.
Step Into – IF the highlighted line of code is a method call, you can use this to “step into” the method, and pause inside of it. This allows you to follow the logic when methods are being called.
![]() Step Out – IF you have Stepped Into a method call, you can use this step back out. Aka to finish the method instantly, and stop on the next line after the method call.
Step Out – IF you have Stepped Into a method call, you can use this step back out. Aka to finish the method instantly, and stop on the next line after the method call.
The green circular arrow is the Restart button, which allows you to stop and rerun the program. The red square is the Stop button, which will stop running the program.
It is important to become familiar with the Debugger toolbar, in particular the “Continue” and “Step Over” buttons. They allow you to easily navigate code after breakpoints, and jump to other breakpoints to ease the search while debugging.
Memory Viewer
Also while the program is paused, you can use the Memory Viewer to inspect variable values. The memory viewer can be accessed through the left sidebar, under the “Run and Debug Menu”
![]()
You can then see all the current variables in scope at the paused line.

This allows you to inspect values, to ensure they get initialized/updated as expected. This is important for bug-hunting things like NullPointerExceptions, as it lets you identify when things do/don’t get set to a value or null.
In the above example, the only two variables in scope are “args” (from the parameters of the main() method), and “i” which is the for loop variable from the conditional breakpoint example above.
If we define another String variable, and pause the program after that variable has been created, we can see it too.

Note: since the for loop has ended, the “i” variable has disappeared and been garbage-collected by Java.
The String variable has a drop down menu in the variable viewer, since it is an object which has attributes. We can open this to see the attributes.
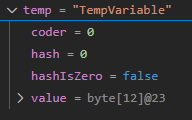
This is an important concept, as it allows us to investigate objects fully. Since the majority of Java code consists of objects, we need this to properly debug.
Debug Console
The final tool you will need to debug is the Debug Console. The Debug Console is a special terminal, which can be accessed with Ctrl + Shift + Y (for Mac, use Command instead of Ctrl).
The debug console allows you to write and run singular lines of code, and print their output. For example, you can simply enter primitive values, and it will print those values back to you.
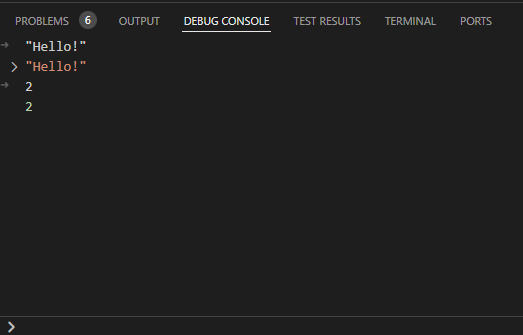
In the above screenshot, first “Hello!” is typed into the Debug Console (including the quote marks), then after pressing Enter, it is printed back to us. Second, the number 2 is entered, which again simply prints 2 back to us.
If we have a visible method which is accessible from the paused spot, we can call that as well and the Debug Console will print the output. If we use the previous example of the “String temp = “TempVariable”;”, and pause at the same spot, we can call that String object’s methods and see the output.
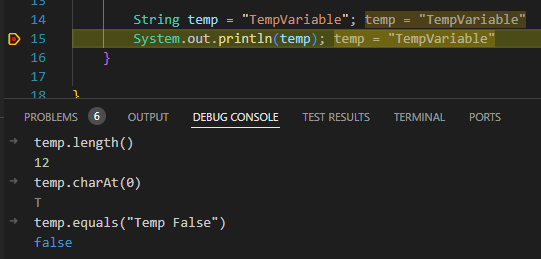
This allows us to call getter methods to get values.
Overview
To complete this Lab, you will not need to write ANY code. Instead, you will run the Driver.java class and use it with the debugger to generate your submitted file.
- The Driver class asks for your netID, then immediately starts sorting the lines of the input file. Enter your correct netID (ex: abc123, not your 9-digit RUID).
- For each line of the file, a random sort is chosen (based on your netID)
- After sorting the file, you will be asked a series of random questions about your sorting simulation. Your netID + answers will print to an answers.out file.
- This “answers.out” file is the one you submit.
- Similarly to Lab 3, this is a sort of “scavenger hunt” using the debugger. Your job is to find or track specific values, to answer your given questions
Getting Started: Once you run the driver, enter your NetID (ex: abc123, NOT your RUID). Then, you can set breakpoints using the debugger (see above), and rerun with those breakpoints. Remember that questions won’t show up until all turns are complete.
When you’re ready to submit, use Driver.java to generate the answers.out file. Make sure you enter all answers exactly as asked – don’t include any punctuation or wording (ex: if you’re asked for a number, ONLY write that number).
Provided Classes
You are provided a number of supporting classes which comprise the game.
The sorting package contains the simulation itself.
Question.java contains the possible questions.
Sorts.java contains four random sorts (and their required helper methods), anonymously labeled. These will be randomly called by SortSolver.java.
SortSolver.java is where the simulation happens, and the input file is read & randomly sorted. This gets called by the Driver.
Driver.java is the file you run. It contains a small window which allows you to enter your netID, and run the simulation. You can then input your answers into the driver, and click a button to print your answers.out file.
StdIn.java, StdOut.java, and StdRandom.java are used for input, output, and random generation respectively.
Do not modify or remove any of these classes.
Directions
You MUST use your own NetID when submitting answers.out, or you will receive a zero on the Lab.
- DO NOT add new import statements.
- DO NOT add any new class attributes
- DO NOT change any of the method’s signatures.
- DO NOT modify the given constructor.
- DO NOT modify any code related to game behavior.
- Modifying program behavior may cause you to find different answers than Autolab.
To Run: Run in Debug Mode through VSCode, ensuring you open the correct innermost SortSolver directory.
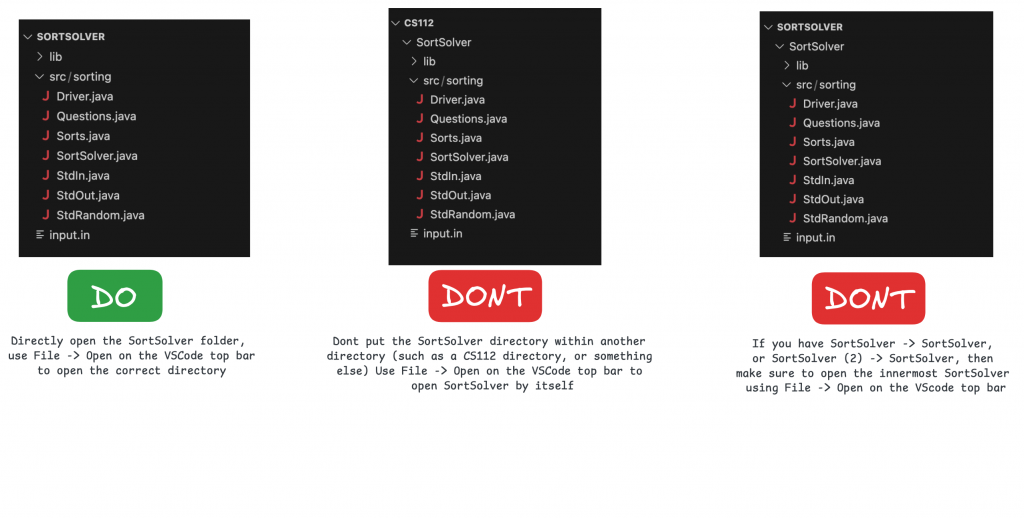
Driver
The Driver class will prompt you for your netID (abc123 form NOT your 9-digit RUID). After you enter it, the simulation will automatically run.
The sorts will instantly simulate, and end. After this, the driver will ask you a series of random questions about the program. You must use the debugger to find the answers to these questions, then enter them in the driver.
NOTE: You must use the “Continue” or “Step Out” buttons to continue past ALL breakpoints after starting the game with your netID. While you are paused at any breakpoint, you will not be able to interact with the Driver. You will not be able to exit out of the Driver while at a break point, use the red square button in the debug toolbar to exit out instead.
After all questions are answered, the driver will print them to an “answers.out” file in your project directory. This is the file you will submit. Make sure to save your answers somewhere when you rerun, so they don’t get overwritten.
Make sure you always run in Debug mode, or breakpoints will not work. Always run with YOUR netID.
FOR ALL QUESTIONS, answer with only a number. No words/letters are required.
Question Help
Question 1: Which sort number is #?
- Free Question:
- 1: Insertion Sort
- 2: Selection Sort
- 3: Merge Sort
- 4: Quick Sort
Question 2: How many helper methods does sort# have?
- Look in Sorts.java. Only some sorts have helper methods, but some may have one or more.
Question 3-6: How many times was sort # called?
- Look in SortSolver.java. Set a breakpoint in the constructor, where the sort # methods are called, then run in debug mode. Use continue and count how many times you hit the breakpoint.
Question 7: What was the first sort number called?
- Look in SortSolver.java constructor. Set a breakpoint on the four sort method calls. Run, and see which breakpoint gets hit first.
Question 8: What sort was called for line number #?
- Look in SortSolver.java constructor. Set a breakpoint on the four sort method calls. Run, and use the continue button to see which breakpoint gets hit on the corresponding line number.
- This question is asking about a specific line number of the input file (there are 15 lines total). If your line number is 7, you will have to hit continue six times after pausing at the first sort.
Before submission
DO NOT MODIFY THE answers.out FILE. You MUST print this file using the Driver.
You MUST use your own NetID when running the simulation, or you will receive a zero on the lab.
Collaboration policy. Read our collaboration policy on our course syllabus.
Submitting the assignment. Submit your answers.out file separately via the web submission system called Autolab.
Getting help
If anything is unclear, don’t hesitate to drop by office hours or post a question on Piazza.
- Find instructors and Lead TA office hours here
- Find tutors office hours on Canvas -> Tutoring
- In addition there is the Coding and Social Lounge (CSL) , a community space staffed with student community managers which are undergraduate students further along the CS major to answer questions.
By Colin Sullivan
